Harvey in Houston: another once-in-a-millennium flood

Hurricane Harvey has been horrifying.  As a friend of many weather enthusiasts and Houstonians, my Facebook feed has been inundated with videos and pictures: first of driving 130+ mph winds and an ominous eyewall when Harvey made landfall as a Category 4 hurricane, then of catastrophic flooding and mass rescue at barely recognizable locations in Houston.  I am nervous for my stranded friends, stomach-sick for the thousands rescued from flooded homes, and generally heartbroken for a city that was my home for 4 years.

1024x1024.jpgBrays Bayou on Sunday, flooding an area where I spent a lot of time in college. Source: Houston Chronicle, chron.com

It is important to understand that this tragedy was inevitable.  Hurricanes and tropical storms happen on the Gulf Coast, and Houston has recently borne the brunt of Allison in 2001, Rita in 2005, and Ike in 2008.  The city’s very development-friendly zoning policy resulted in an expansive urban sprawl with lots of impervious surfaces, which restrict rainwater absorption and runoff.  The flooding problem is exacerbated by the natural geography of the greater Houston area: a very flat coastal plain laced with marshy bayous.  To accommodate the runoff, Houston’s bayous have been dredged into deep concrete channels, meticulously engineered to push maximum runoff toward Galveston Bay.  This drainage infrastructure was designed for a 100-year flood (13 inches of rain in 24 hours), but storms have met or exceeded this benchmark in each of the past three years, indicating that statistics significantly underestimated the region’s flood potential.  For more information about Houston’s storm infrastructure dilemma, I highly recommend this article from the Houston Chronicle earlier this year that inadvertently predicted this catastrophe.

920x920.jpg

Brays Bayou last December, in the process of widening.  Houston’s bayous are engineered to have a constant downward slope and a shape that minimizes friction and blockage potential.  Source: Houston Chronicle, chron.com

Also important, the situation could have been much worse if not for the efficacy of warning agencies and emergency response.  Harvey’s formation was predicted with confidence about 5 days before landfall, and the threat of excessive rain due to a stalling tropical depression was forecast with reasonably accurate rain totals (an impressive feat considering the lack of precedent).  Houston’s mayor encouraged people to hunker down in their homes, which seems like the right call, especially comparing this storm’s death toll to that of Hurricane Rita when millions were instructed to evacuate.  Social media has helped coordinate rescue efforts where emergency response units have been stretched thin, and you can hope that everyone has been accounted for.  It may take several years to fully recover from this multi-billion dollar disaster, but I am optimistic that Houston will, leveraging insights from this and from past disasters to become a more resilient, vibrant city.

Total Solar Eclipse in Tennessee

I traveled to the Nashville area to experience the total eclipse: it was everything I could have imagined and more!  I watched the 90-minute approach to totality through eclipse glasses, watching the mostly sunny day get dimmer and dimmer as the moon took a bigger and bigger bite out of the sun.  By about 5 minutes before totality, it looked like evening, fading to twilight as the last sliver of sun was blocked.  The crowd gathered in the park cheered as the final glints of direct sunlight disappeared.  While I thought the partial eclipse was pretty phenomenal (after all, I missed the last major eclipse in ’79), totality was beyond amazing! It’s hard to describe what the eclipse looked like in real life in words: it was a dark moon with a glorious radiating halo of sunlight, the focal point of a night sky surrounded by a 360 degree sunset.  But words don’t do the scene justice at all, how cool it was, both figuratively and in sudden temperature drop.  Maybe a picture?

20914712_2055974241283190_3681475242538342385_n.jpgPhoto credit: Mengya Li

One of the forecasting challenges leading up to the eclipse was predicting cloud cover.  NWS released cloud cover model results starting 10 days in advance, zooming in on a consistent forecast within 4-5 days leading up to the eclipse (it gave a storm chasing friend time to drive from Texas to Nebraska to Kentucky for optimal viewing).  While this forecast was probabilistically accurate — Tennessee was mostly sunny — there were still a few large cumulus clouds that obscured the view of several friends.  Like most weather forecasts, cloud cover models are based on large-scale weather patterns, pressure and temperature differences occurring on regional scales and interpolated over a “small-scale” grid spacing of 4 km.  However, knowing that the winds would be light from a southerly direction, I followed a hunch and went east of Nashville, hoping to avoid potential cloud generation downwind of the Nashville heat island.  As the eclipse was unfolding, there was indeed cloud cover to the north/northeast of Nashville…just another example that is encouraging me to investigate the effects of small-scale terrain on our weather.

I may edit this post as I continue to reflect on the truly awesome experience.  I’ll also be following the results of NOAA research into eclipse effects on weather, summarized here: http://research.noaa.gov/News/NewsArchive/LatestNews/TabId/684/ArtMID/1768/ArticleID/12275/NOAA-scientists-get-rare-chance-to-study-the-effects-of-an-eclipse-on-weather.aspx

I got pulled over for drugs

It happened yesterday, when I was driving through Missouri.  A highway patrolman started tailing me, so naturally I stuck to the speed limit, watched my following distance, and focused on making a straight path in the middle of my lane.  After about 5 minutes, the flashing lights came on and I pulled over.  I had heard of these “routine traffic stops” happening to others, so I was not surprised that it was finally happening to me.

When I rolled down my window, the officer explained the ‘reason’ for the stop.  He said that Missouri is strictly compliant with the AAA recommendation for a 3 second following distance, and that my following distance was “1 to 2 seconds tops”.  I wasn’t familiar with Missouri law (I am now, though: while there is no strict code, state courts have ruled that the local jurisdiction is allowed to determine whether a distance is ‘safe’ based on the driving conditions).  He took my driver’s license and insurance, then asked me to get out of the car while he processed my warning.

You may be thinking, “Why did you need to get out of the car for a traffic violation?”  This provides the officer with the opportunity to find probable cause for something more serious.  Complicating matters was my new Oklahoma license plate, which didn’t appear in his database.  So he asked for my new registration form, old registration form, and title to the car (which I was lucky to have…you generally shouldn’t be carrying your title).  I had to return to my car to retrieve the documents, during which he peered into my back windows and asked me if I was carrying any marijuana.

I said no, convincingly, kind of relieved we finally reached the point of all this.  But we weren’t done: the officer said he smelled “something,” which is enough to constitute probable cause for a search.  I offered to help him go through my cluttered backseat, but he was content to shift a couple of bags around on his own.  He did not ask me about cash or other valuables (which he could legally seize with similarly vague probable cause under civil forfeiture law), but he did ask several detailed questions about where I was going and why, looking for me to say…something.  I didn’t have anything to hide, so I got off rather easily within about 20 minutes.

But things may not have been so easy if I hadn’t complied so well with the officer’s demands.  While accused persons are often encouraged to stand up for their rights, he technically had the legal authority to pull me over and conduct the investigations that he did.  I unfortunately fit the profile of a drug smuggler: young male driving an older, out-of-state vehicle alone on a weekday afternoon.  And I can imagine the scenario going much worse if my skin was a different color…when he asked me to step out of the car, I inadvertently had a hand in my pocket.  It could have been much, much worse than a simple request to put my hands where he could see them.  It’s a shame that incidents like these occur, as they have eroded much of the public’s trust in institutions that are supposed to keep us safe.

Flatland Revisited

One of the hardest things for me to grasp is why humans can’t all get along.  Even harder than physics.  So when I want an escape from the daily news of irreconcilable differences coming to a head, I often read the various forms of science literature, which are predicated on hard facts and intradisciplinary consensus.  This weekend, I reached back for one of the classics in physics: Flatland, written by Edwin A. Abbott in 1884.  While I cannot recommend the book to anyone except the most determined reader, it did inspire some interesting observations about the world, which, as the namesake of my blog I am compelled to share.

Flatland, told from the perspective of a square accustomed to life in a two-dimensional world as he is introduced to a three-dimensional world, is referenced by physicists as an example of the limits of human perspective when it comes to visualizing higher order dimensionality.  However, by the second chapter it devolves into a description of Flatland’s social hierarchy wherein circles and regular polygons make up an aristocracy ruling over a proletariat of isosceles triangles and line segments (who were “one-dimensional” women…might as well throw in sexism along with racism and classism).  Beyond criticizing those who reject science, Abbott slams the Victorian era leadership for propagating social inequality, but he goes so overboard with his allegorical hierarchy that at times it seems like he can’t escape his own Victorian autocentrism.  The intended lesson in perspective is clouded by his own cultural biases (but…it was 1884).

A recurring theme of Flatland is the inability to convince others of ideas that are outside their perspectives, and the conflict caused therein.  The difficulties faced by the square, first to understand the third dimension then to try and convince others of its reality, bear a striking similarity to the partisan dissension in America today.  The 2016 election was the first in my memory in which the presidential candidates, neither of whom represented the ideological extreme within their party, could not carry on a coherent debate because they started with different “facts.”  People engage in heated political arguments, very seldom to be swayed from their initial opinions.  I try to avoid these types of discussions altogether, since my views have been called out from both sides for being either “naive and brainwashed by liberals” or “insensitive and blinded by white privilege” within the last year.

But what happened in Charlottesville this weekend…it was horrifying, despicable, backward, and too topical to ignore.  While discrimination based on number of sides in Flatland paints racism as something stupid and trivial, deep-seeded racism is still very real in America, especially in groups of people who are insulated from outside perspectives.  White supremacists/neo-Nazis/adherents to white nationalist beliefs, these people have created their own Flatland communities in which they are informed by “alt-right” news and online forums while isolated from broader society.  Their monochromatic world is unacceptable in the mainstream society of the 21st century, completely incongruous with the experience of the majority of Americans. Moreover, it seems impossible to talk someone out of a racist ideology, which makes situations like this weekend seem like we’ve reached an impasse as a society.

I was lucky to grow up with exposure to cultural and religious diversity, having met people from over 50 countries and adhering to all major world religions.  I wish I could challenge anyone with a known prejudice against another group of people to get to know members of that group, because I have seen firsthand that a broader perspective leads to empathy and tolerance.  For example, I’ve watched a friend’s Islamophobia go from “Muslims are terrorists” to “Muslims believe in jihad, but not my friend ____” to “huh, Muslims are some of the most caring people I have ever met” just by having a close Muslim friend in college.  Supporters of the alt-right agenda need more friends of different backgrounds, not to scream obscenities in a counter-protest but to connect on the basis of our shared humanity.  After all, it’s high time everyone moved on from Flatland.

If you feel like the situation in Charlottesville was incited by “many sides”, please take the time to watch this remarkably objective report: VICE (Warning: disturbing footage)

Publishing my science

Two milestones for me this week: first, it marks the 1-year anniversary of obtaining my master’s degree from Vanderbilt. Second, my paper covering my latest project when I was there has finally been published!

What took so long?  I’ll take you through the process of how this paper was executed–the fast way, as our lab is comparatively efficient at this publication business:

  1. Unless a breakthrough falls into your lap by accident, you need to start with an idea.  This was easy: my research advisor decided to probe a solar energy absorbing material that I had already synthesized for my previous project with a really cool ultrafast laser setup that we had access to at Oak Ridge National Lab.
  2. Next, you need to collect data.  Enough to fill at least 5 figures, as is the policy of most scientific journals.  I went to Oak Ridge 3 times, and Dr. Aziz Boulesbaa helped me test upwards of 50 samples with the laser.  I collected my final round of spectra last July and completed analysis before leaving at the end of August.
  3. The first draft of the paper is what you make of it. While others I know have spent weeks compiling data and phrasing arguments, my labmate Holly and I co-wrote this draft in 3 days, prioritizing content over style.  The most time consuming aspect is the reference section, as the reviewers expect you to give credit to the founders of the field and to back up every idea (even original hypotheses) with evidence that it has been previously observed.  Holly worked on this after the 3 days, but we had a decent first draft in November.
  4. The editing phase took quite some time. First, our research advisor held on to it for a couple of months, deliberating how to phrase the introduction section so it would both correctly represent and sell the importance of our study.  Then, we thoroughly edited grammar before sending it to our collaborators at Oak Ridge.  The combined expertise of our 3 collaborators returned about 5 pages of suggestions/modifications (for a paper less than 10 pages), which led to a reanalysis of data and overhaul of nearly half of all figures.  All authors then had to approve the rewritten paper and double check the language.
  5. We were finally ready to submit to a journal! At the beginning of April, we submitted to Nano Letters, where the paper was rejected by the editors a month later.  A few small edits were made to tailor the manuscript to physical chemists, then we submitted to the Journal of Physical Chemistry Letters.  This editor also rejected the paper on the grounds that it was “not urgent” and “marginally related to physical chemistry” (which were the same comments we got from Nano Letters… huh), but we successfully appealed and the paper was sent to reviewers.
  6. Two scientists in a related field critiqued the paper, and we went through another process of revisions to address their comments. To no avail, because the editor then rejected the revised manuscript on the same grounds. We then submitted to Nanoscale, where my advisor knows the editor and at least one reviewer. These reviewers gave what amounts to a very positive response to the article, returning 8 comments that ranged from clarification questions to “please redo all experiments to show that your data is statistically accurate.”  Though we protested the most outrageous comments, we addressed enough of them that the paper was accepted with no further colloquy.
  7. Finally, you get to see the typeset proof, where you edit your manuscript for the umpteenth time and still find several language and format errors…but at least you’re done, and it gets published online a few days later.

It’s a long process, though it would have been much shorter had we initially settled for Nanoscale.  We might have been able to publish a couple months faster in “letter” or “communication” format, but these journals also require high impact more stringently.  But more importantly it is a flawed process: editors and reviewers can (and do) preferentially accept studies done by colleagues, creating publication and citation ‘rings.’  These rings are a well-documented problem in some fields, and I have experienced both sides, along with certain questionable suggestions that would have been hard to execute if the reviewers were on the fence.  The overall process makes publishing as an independent scientist quite difficult, leading me to look into alternatives to formal peer review as a means to publicize my tornado research.

Here are my papers, if you’re interested. My graduate research was in physics of electrons in perovskites (a newly rediscovered mineral with promising properties for solar energy conversion). They’re not worth the 40-something British pounds, so I can send you a PDF version if you don’t have institutional access and really want to geek out:

Paper #2:

Talbert, E. M.; Zarick, H. F.; Boulesbaa, A.; Soetan, N.; Puretzky, A. A.; Geohegan, D. B.; Bardhan, R., Bromide Substitution Improves Excited-State Dynamics in Mesoporous Mixed Halide Perovskite Films. Nanoscale 2017, 9, 12005-12013.

Paper #1: (review process also took around 6 months)

Talbert, E. M., et al., Interplay of Structural and Compositional Effects on Carrier Recombination in Mixed-Halide Perovskites. RSC Adv. 2016, 6, 86947-86954.

Co-authored review article:

Erwin, W. R.; Zarick, H. F.; Talbert, E. M.; Bardhan, R., Light Trapping in Mesoporous Solar Cells with Plasmonic Nanostructures. Energy Environ. Sci. 2016, 9, 1577-1601.

Tulsa Tornado 8/6/2017

An EF2 tornado took the city of Tulsa, OK by surprise early Sunday morning, injuring 30 people and causing tens of millions of dollars in damage.  The National Weather Service had eyes on the storm, issuing a severe thunderstorm warning for the greater Tulsa area at 12:30 AM.  Isolated tornadoes are expected within this type of thunderstorm, which was a fast-moving QLCS (quasi-linear convective system, commonly called a squall line).  So why was it a surprise?  First off, the NWS was working off of these forecasts for severe thunderstorms and tornadoes, respectively:

080617 Outlook.PNG20170806 0100 UTC Day 1 Tornado Probabilities Graphic
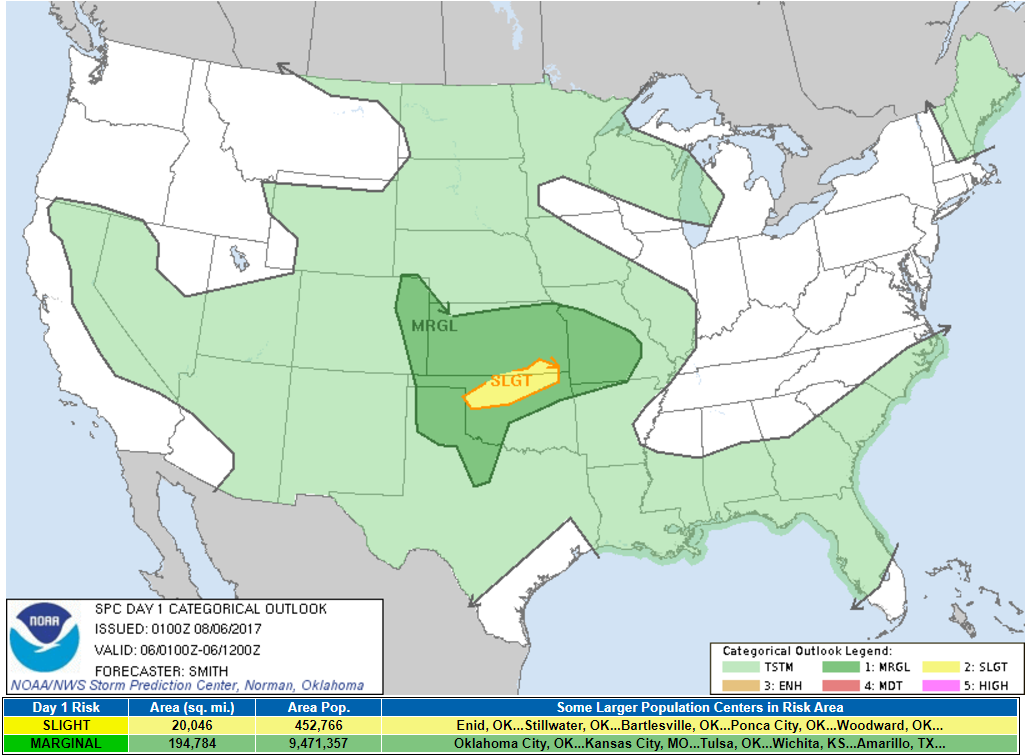
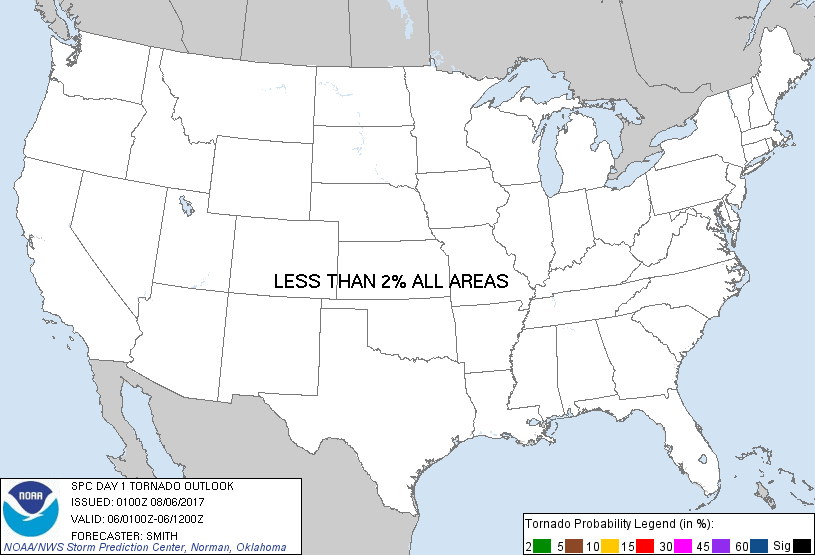
The SPC’s 8:00 PM CDT convective outlook shows a “slight” risk of damaging storms in northern OK (an even lower “marginal” risk in Tulsa), top.  However, the latest tornado outlook, bottom, predicted minimal risk. Source: SPC, NOAA

The squall line passed downtown Tulsa at 1:10 AM and spawned a tornado at 1:19 AM. This tornado stayed on the ground for between 6-8 minutes, carving a 6 mile long damage swath through urban/suburban development.  A tornado warning was issued at 1:30 AM, after the first and most devastating tornado lifted off.  The damage tracks are shown below:

Tulsa 080617 EF2.PNGThe EF2 tornado touched down 4 miles SE of downtown Tulsa, tracked for about 7 miles, then lifted off briefly to reform as an EF1 tornado in Broken Arrow. Source: NWS

Saturday was a warm, muggy day with a high near 90 ºF with a dew point near 70 ºF. After sundown, a line of convective storms initiated along I-35 near the OK-KS border.  In the Tulsa area, light rain showers reveal on radar that the wind is blowing steadily from the WSW for the hours leading up to the squall line.  Downtown Tulsa is tucked into the Arkansas River valley, and you can imagine that the urban heat island around downtown and southwest Tulsa is not as well ventilated by WSW winds as the surrounding terrain.  When the wind shifts dramatically to the WNW, this heat island is the source of an updraft.  Five minutes later, a tornado with 120+ mph winds is spawned beneath this updraft.  I’ll try to dissect the radar loop:

Tulsa radar short.gif
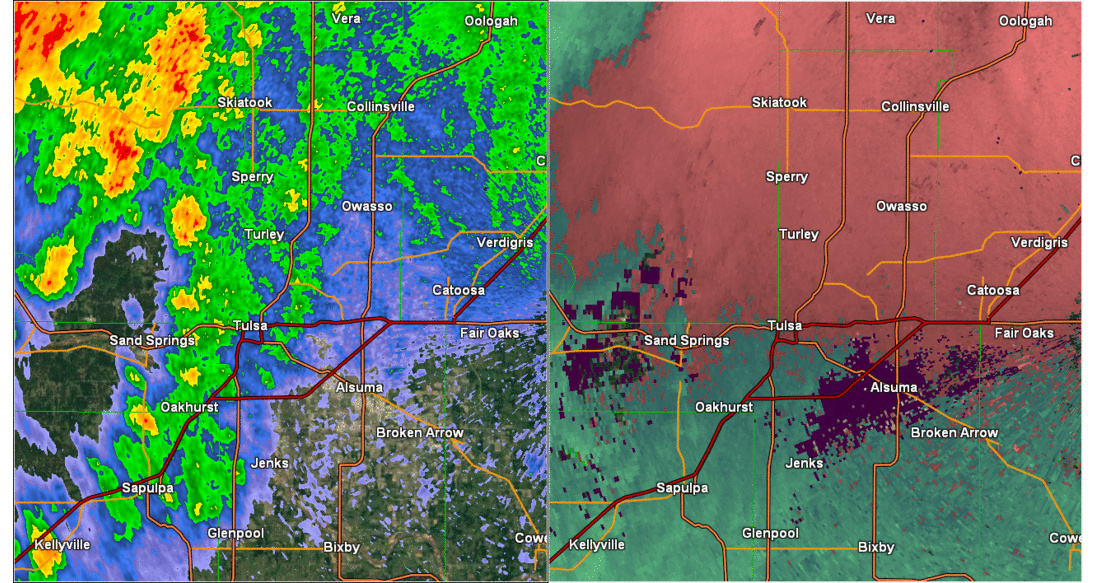
ENE-moving showers are overtaken by a squall line moving ESE at 55 mph, as shown by the reflectivity plot, left.  The tornado shows up in bright green on the right panel (SRV), with droplets recorded moving up to 110 mph ~1000 feet above the ground.
Tulsa tornado map.PNGThe industrial area southwest of Tulsa, highlighted, is sheltered from WSW winds.  Areas of elevated temperature and humidity are more likely to produce updrafts in a convective environment, and this buoyant “bubble” of warm, humid air is released when the wind shifts.  The storm motion and damage path are depicted in red.  While an updraft alone does not guarantee tornado formation, it certainly is a key ingredient in vortex generation.
Tulsa updraft.png
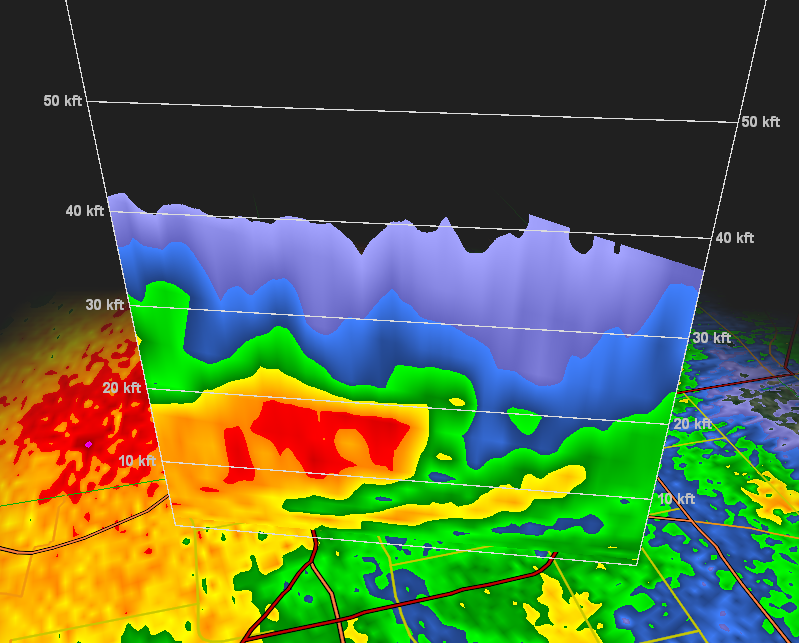
This cross-sectional radar snapshot ~3 minutes prior to touchdown includes an area of lower reflectivity just inside the leading edge of the storm, indicating a superheated updraft emanating from within the highlighted area of the map.

With the information they had, NWS executed their usual role passably, releasing a warning over half an hour ahead of the storm, albeit only a severe T-storm warning. While Oklahomans are culturally in tune with the threat of tornadoes, we’re not always expecting them in the middle of the night in August.  There are myths to be busted before warnings can be effective.  The idea that tornadoes only happen between March and June?  Statistically, it’s possible for one to strike around here any day of the year.  The idea that tornadoes don’t strike urban areas? Tulsa and New Orleans, as well as smaller cities such as Hattiesburg MS and Albany GA, have been hit this year alone.  The idea that there are far more “false alarms” than actual tornadoes?  I’m hoping that a more pinpointed warning system that considers surface features will help the public respond more effectively to tornado threats.

Radar imagery produced using Gibson Ridge LevelX software, using NEXRAD data from NOAA/NCEI https://www.ncdc.noaa.gov/

GOES-16: the newest weather research tool

Last November, NASA launched the coolest Earth-orbiting satellite to date, one that I’m particularly interested in for its high-resolution weather imagery.  GOES-16 (GOES stands for Geostationary Operational Environmental Satellite) is the latest in a long line of weather satellites that have been sending us cool pictures since 1960, when meteorologists had to squint to pick out storm structures in grainy analog images like this:

TIROS' First Look

This is the first image received from an American weather satellite. Source: NASA

Anyway, GOES-16 provided some fascinating images of supercell thunderstorms during the Spring 2017 storm season.  And while this satellite is undergoing in-orbit testing in advance of November 2017 (when it is scheduled to replace GOES-13), the images are open-access from an archive like this.  My favorite satellite loop is that of the most photogenic supercell of the year, a monstrous stationary storm near Dimmitt, TX on April 14th that spawned 3 tornadoes over 3 hours:

Dimmitt TX Satellite.gif
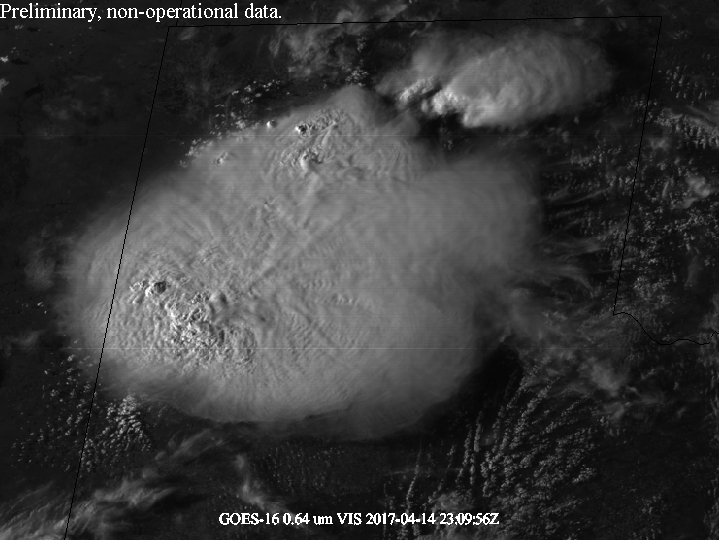
Reflectivity from cloud tops creates a high-resolution map of the storm.  The “bubbling” areas are active supercell updrafts, and the outflow boundary extends over 150 miles across the Texas panhandle. Source: NOAA

At first glance, you might be surprised that these storms look like bubbles reaching the surface of water.  That’s because the fluid flows within these systems show some analogous traits.  Consider an air bubble rising in water: the buoyancy of the air forces the water aside, whose friction in turn pushes the air radially outward at the top of the bubble.  Thus, both systems have an updraft in the center and downdrafts on the flank.  This has led some scientists to model supercell updrafts as warm bubbles released from the ground surface, where the rotation comes from the concentration of angular momentum within the “air” phase.  If this approach is valid, then my research into variations in ground-level conditions could predict where and when these warm “bubbles” rise within the storm, which has huge implications for tornado prediction.

Finally, check out the standing waves!  The outflow clouds are able to transmit the ripple effect of updraft turbulence entering the outflow layer at the top of the supercell anvil cloud, much like ripples on the surface of water.  So can a tornado reasonably be modeled using this simple rising bubble analog?  Like most atmospheric scientists, I’m not convinced any lab scale models can sufficiently capture the dynamics within a tornado.  But I won’t rule out the possibility that a two-fluid model like this could be useful for estimating certain properties or simplifying computationally expensive simulations.  I’m certainly looking forward to more GOES imagery, both for science and for its natural beauty.

—–

Figure 3 | Pressure and velocity distribution of the air bubble rising in a water tank at p ffiffiffiffiffiffiffiffi t 1⁄4 2 : 8 R = g . The bubble contour is compared to the reference solution by Grenier et al. (2009).                                                                      Cross-section of a flow field representing an air bubble rising in water. Source: Meister and Rauch, 2015: “Modelling aerated flows with smooth particle hydrodynamics”

Image result for supercell thunderstorms      
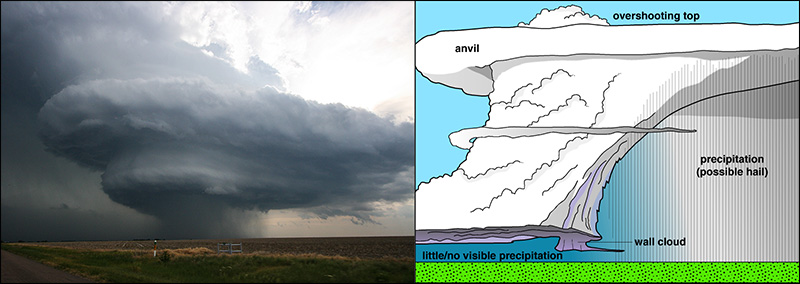
Supercell thunderstorm structure, as viewed from Earth. Source: National Severe Storms Laboratory (NSSL)